Estimated reading time: 7 minutes.
excerpted from: roast summit 2022 session 3 “tasting the roast curve”.
What is “the perfect roasting profile”?
Ever since the idea of “rate of rise” (or ROR) was introduced into the coffee world, roasters all around the world have started to view this particular variable, along with the roast curve, as some kind of “holy grail” for coffee roasting. No doubt, by calculating ROR and keeping track of the roast curve during roasting, we as roasters seem to have obtained a powerful way to steer the direction of our roast; And with the automation and digitalization of roast curve monitoring techs, life just seems to become easier and easier for we roasters, right ?
Well, those who have roasted for a sufficient time probably know that, even with all the fancy curves and numbers, the confusion and frustration when drinking the final cup have never really lessened - they might have even grown! So, even with all these new data recordings, can we really keep our mind from blowing up? The short answer is NO, according to Nicki Amouri, speaker of the roast summit ”Tasting the roast curve” session.
Luckily, when faced with such a complex task, we can always turn to our trusted friend - experimental design. The core concept here is: for one experiment, you only vary one thing (variable) at a time and try your best to hold all other things the same. By this way, when you evaluate the outcomes and notice a difference, you can relate this change in results to the variable that you have altered much more confidently.
The “Variables” within a roast profile
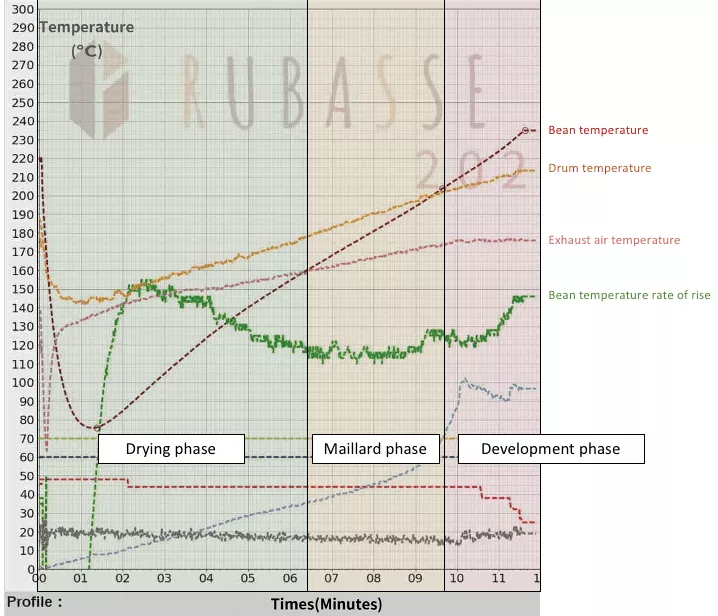
The roasting community has now come to a consensus that end temperature differences will give the same green coffee totally different roasting results (no matter taste-wise or color measurement-wise), but this is by no means the only variable that controls how a roast tastes. Here, the experiments are mainly about how varying the lengths of the different segments on a typical roast curve might affect the final taste. A roast curve is segmented into three stages, being the “drying phase” (or time to yellowing), the “maillard phase” (time between yellowing and first crack), and the widely-recognized “development phase” (time from first crack to batch dropped).
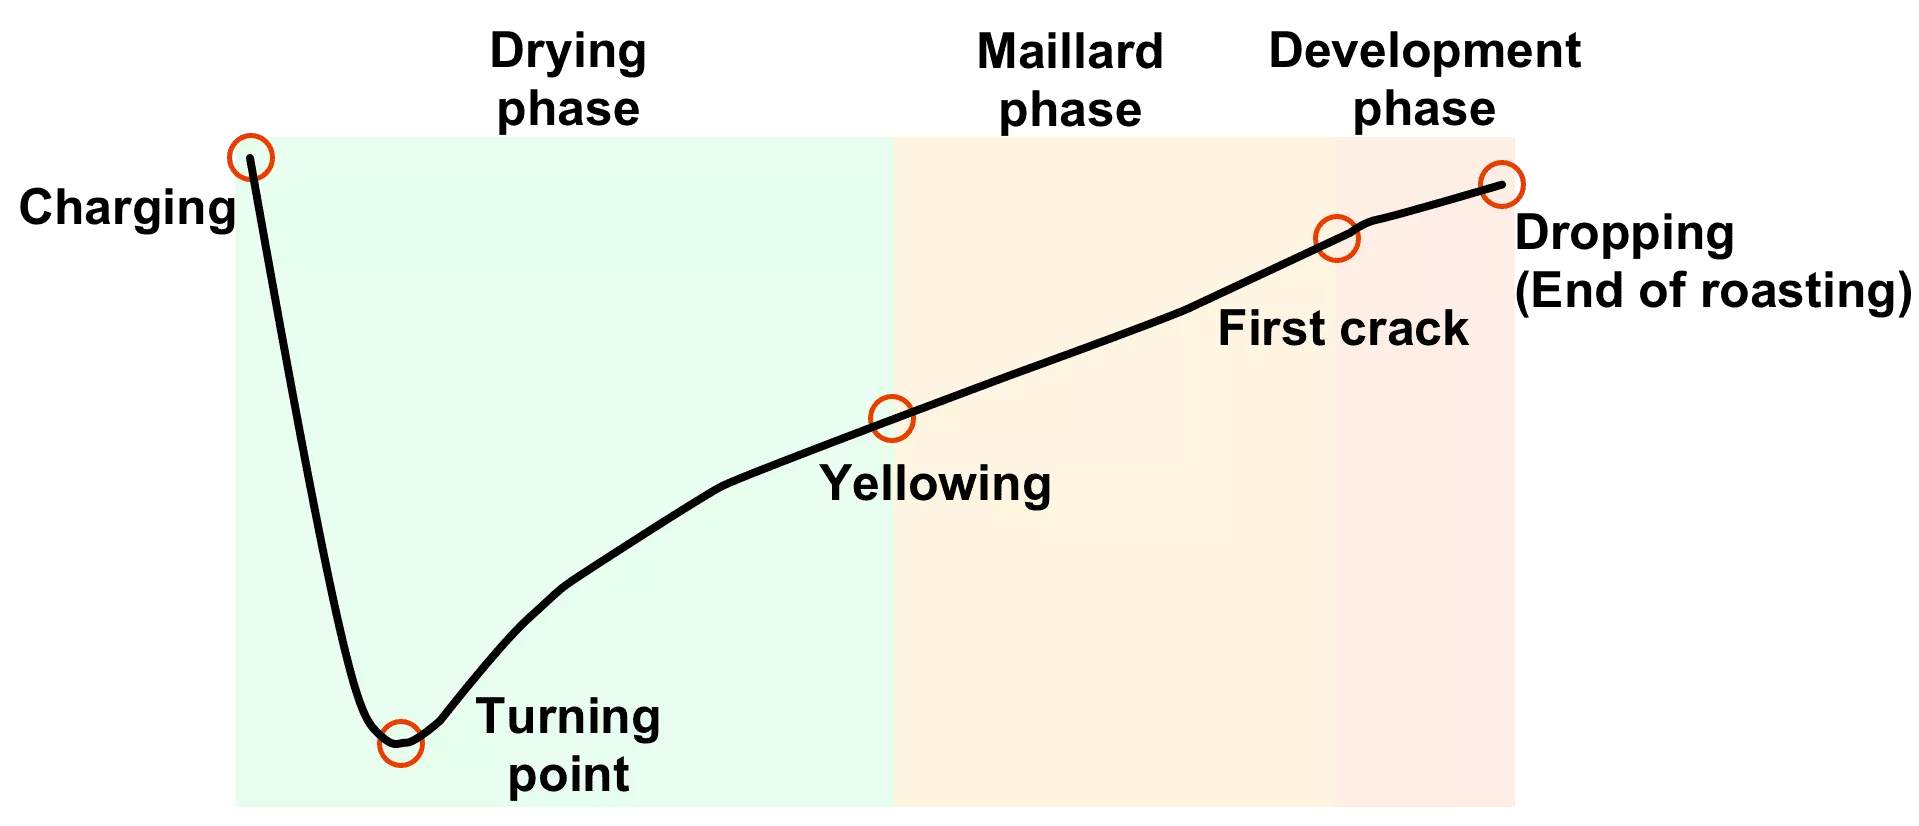
All batches in this experiment were dropped at identical bean temperature readings (212.8°C/415°F), and by altering the length of one specific roast segment, the same coffee was roasted three times, and the taste results was compared to find what sensory changes might be achieved. For a rough reference on the final roast degree, all roasts had a first crack temperature between 200 to 203.3°C (392 to 398°F), meaning that drop temperature was about 10°C (18°F) higher than first crack temperature. The coffee used throughout all experiments is a washed Costa Rica.
The Experiments
Notice: For following comparison graphs, the total lengths of the color bars represents the overall "flavorfulness" of the cup, while each color bar represents the intensity of individual flavor attributes.
Length of maillard phase
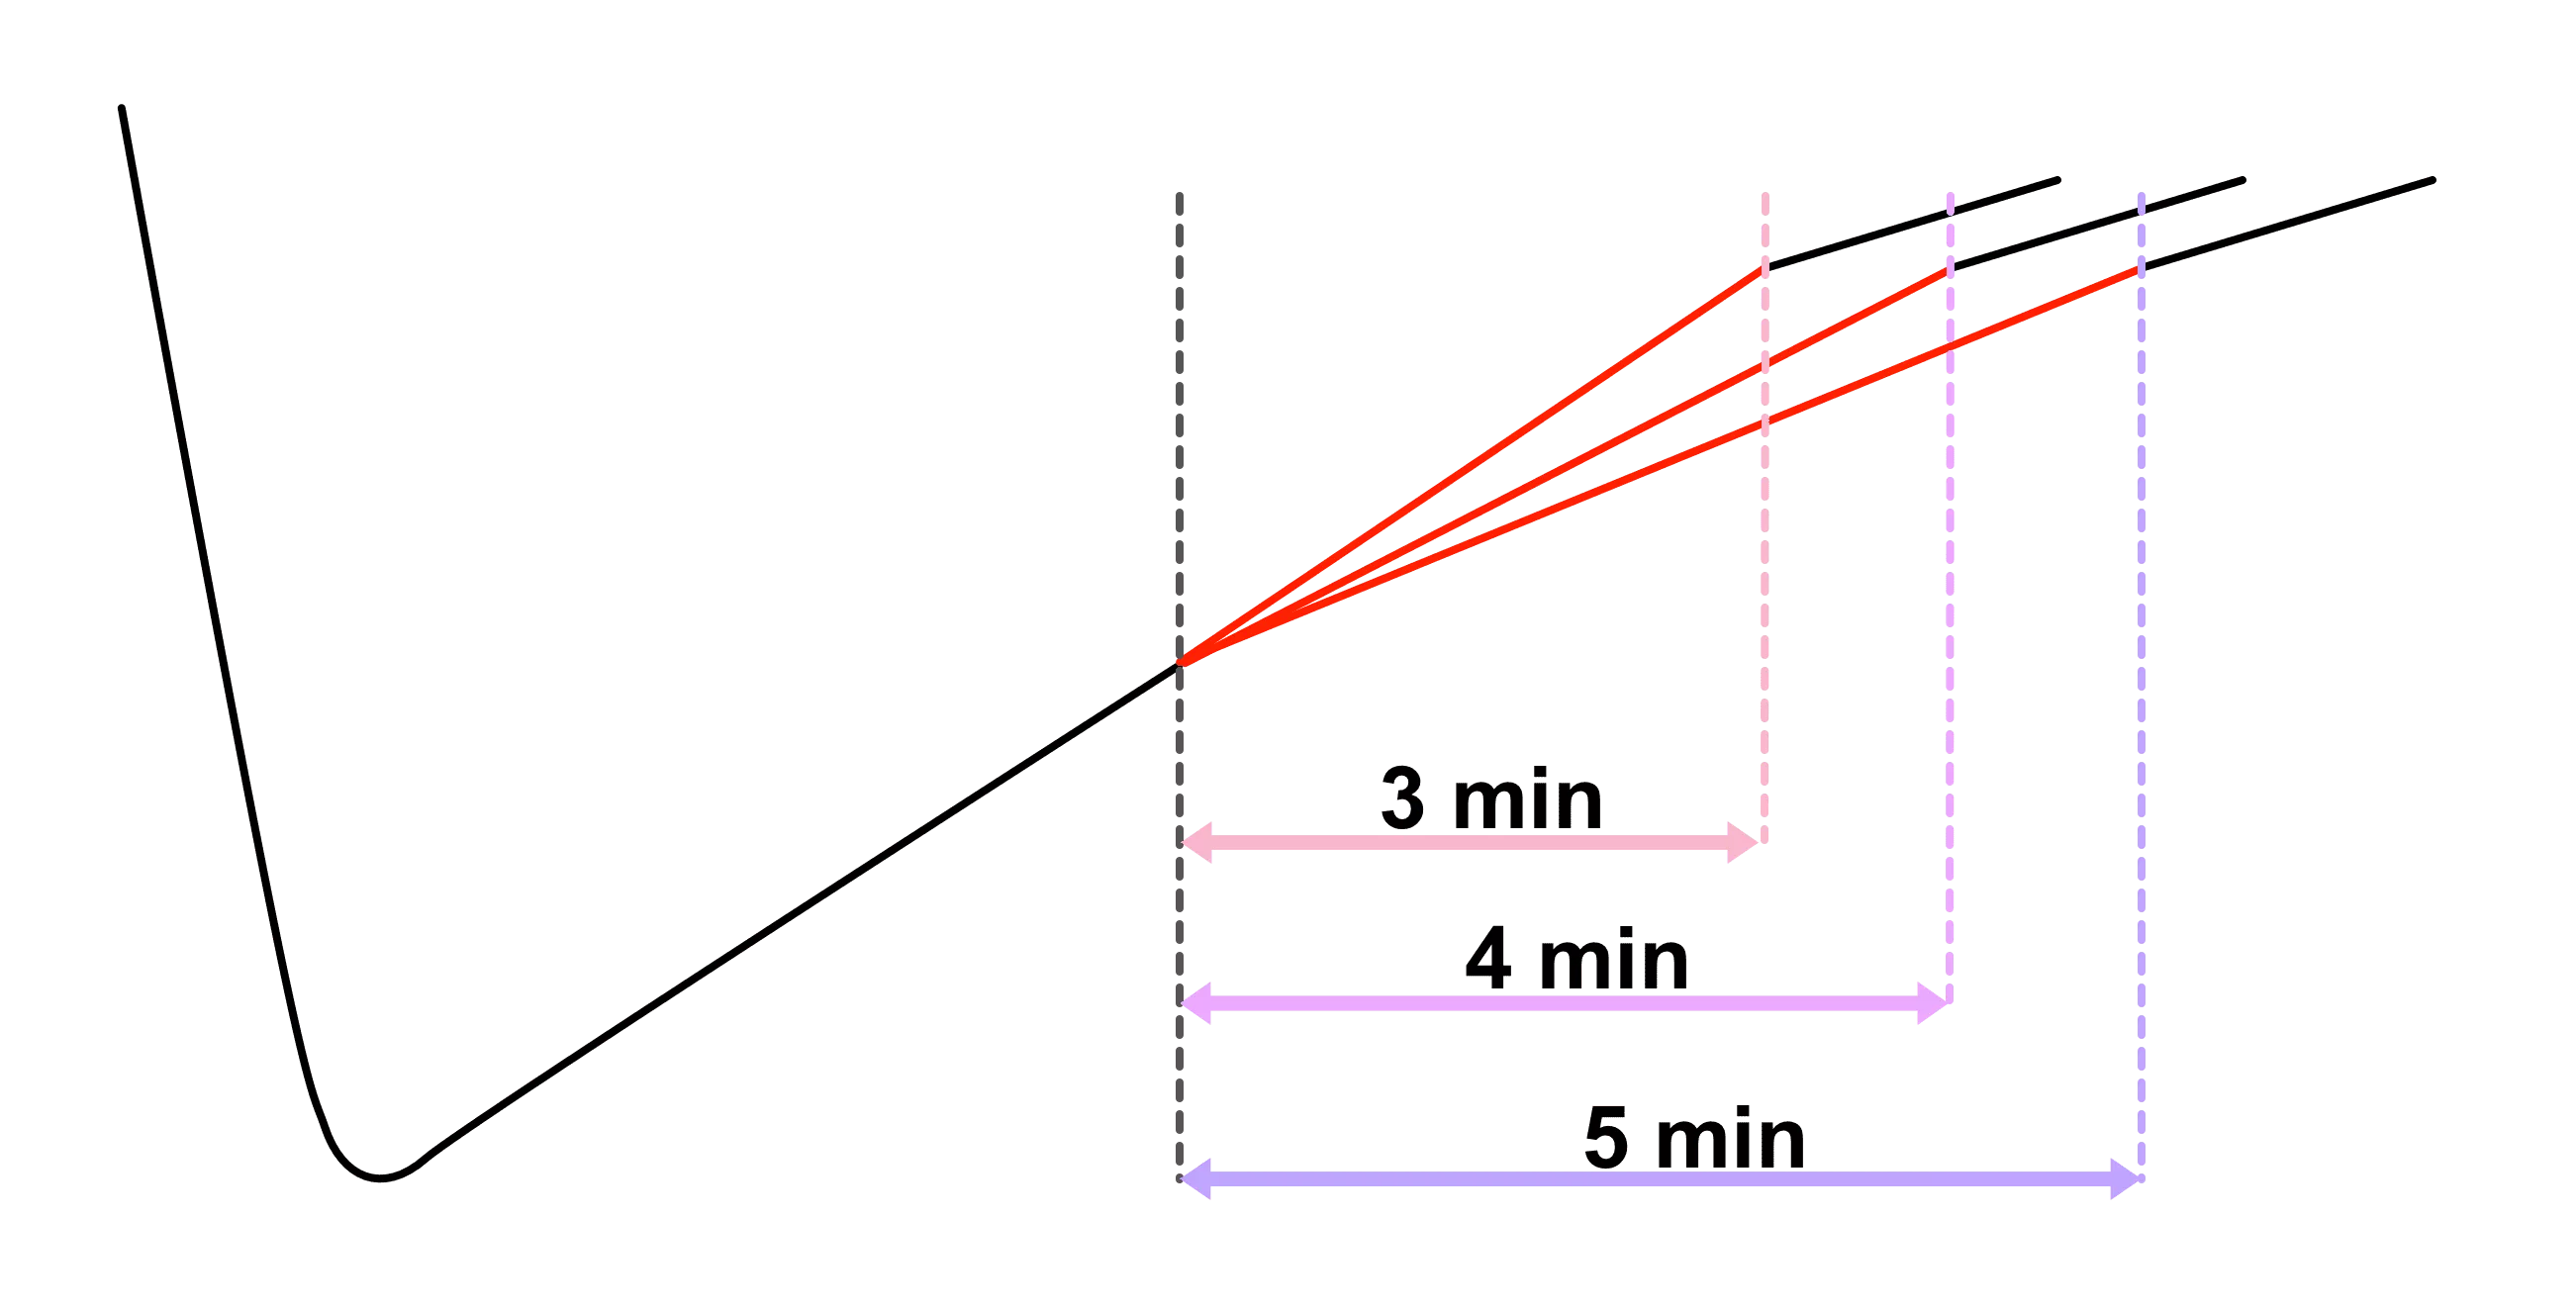
Maillard phase results
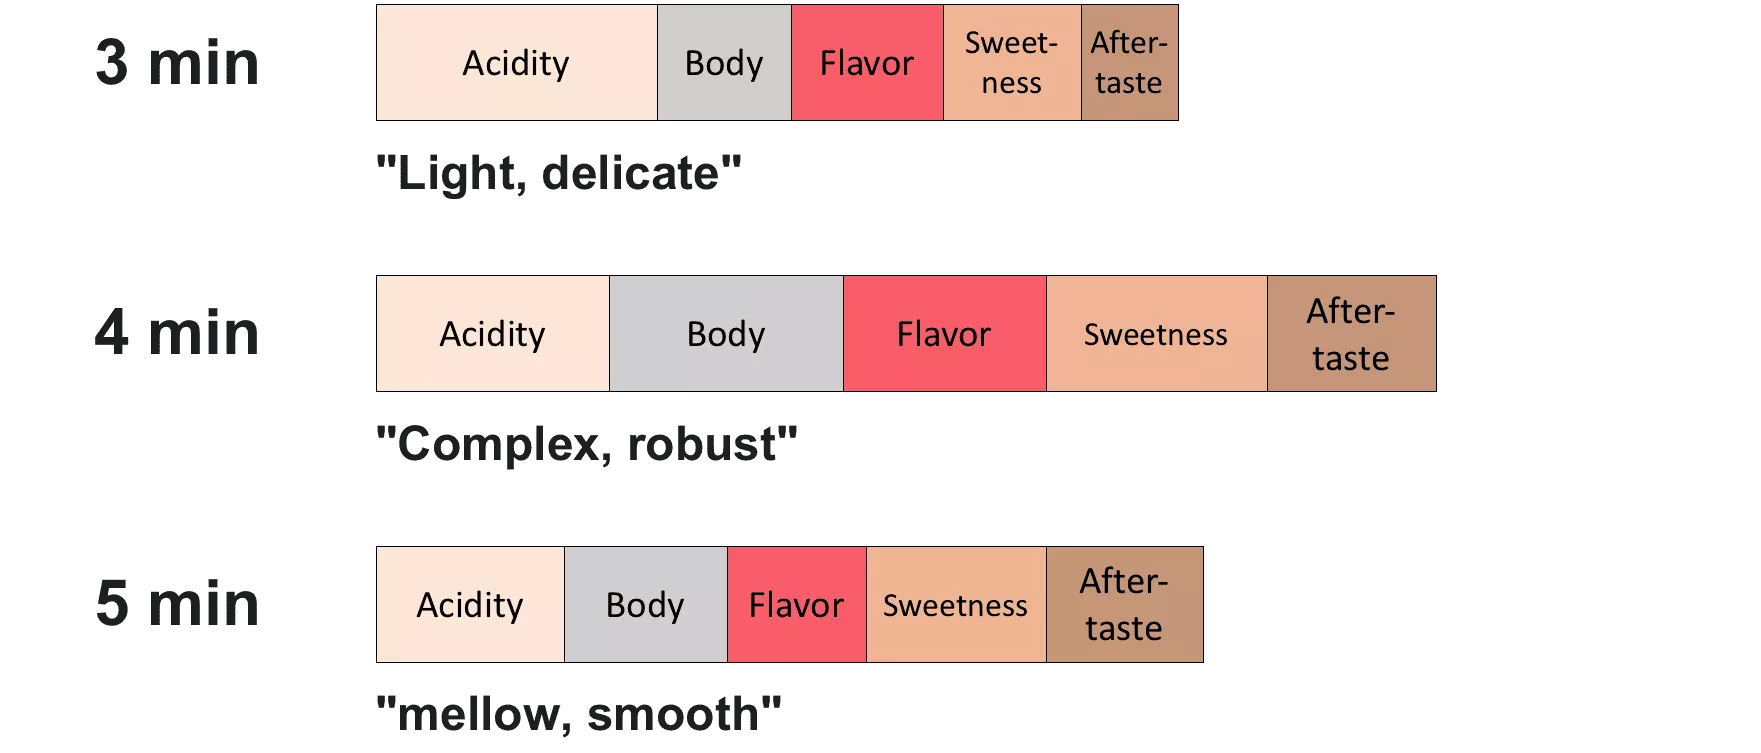
It is concluded that body was affected the most when we varied the length of maillard phase. For this experiment, we can see that the total lengths of color bars which shows the overall flavor intensity varied significantly, and the cup with 4 minutes maillard phase was the most "complex and robust" one.
Length of development phase
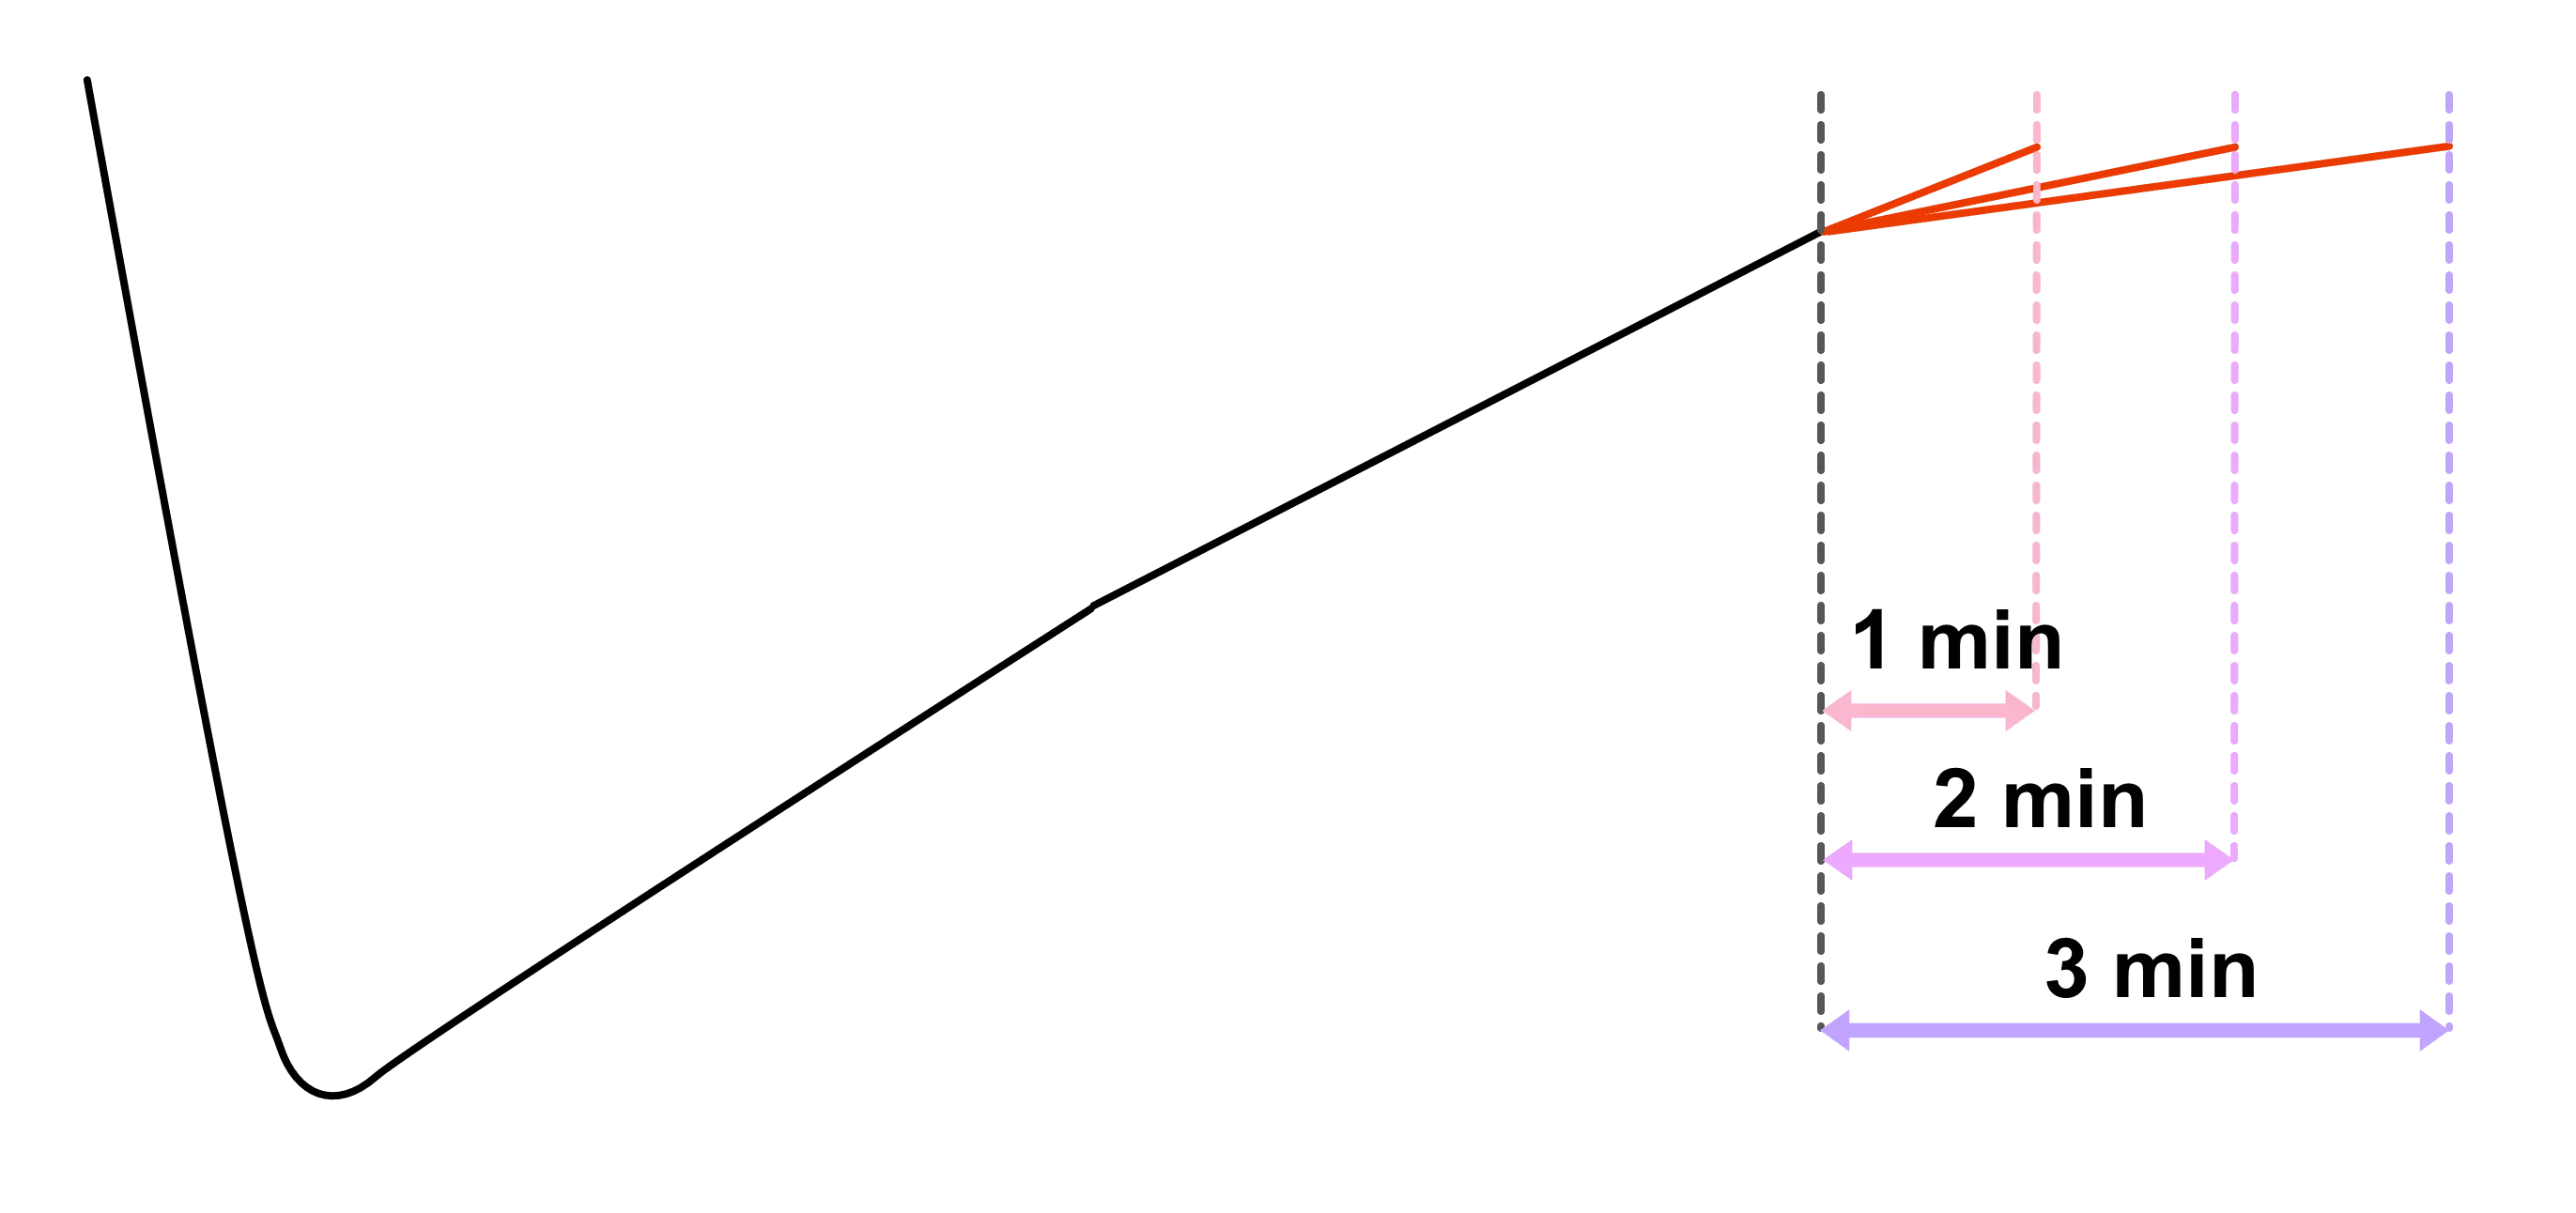
Development phase results
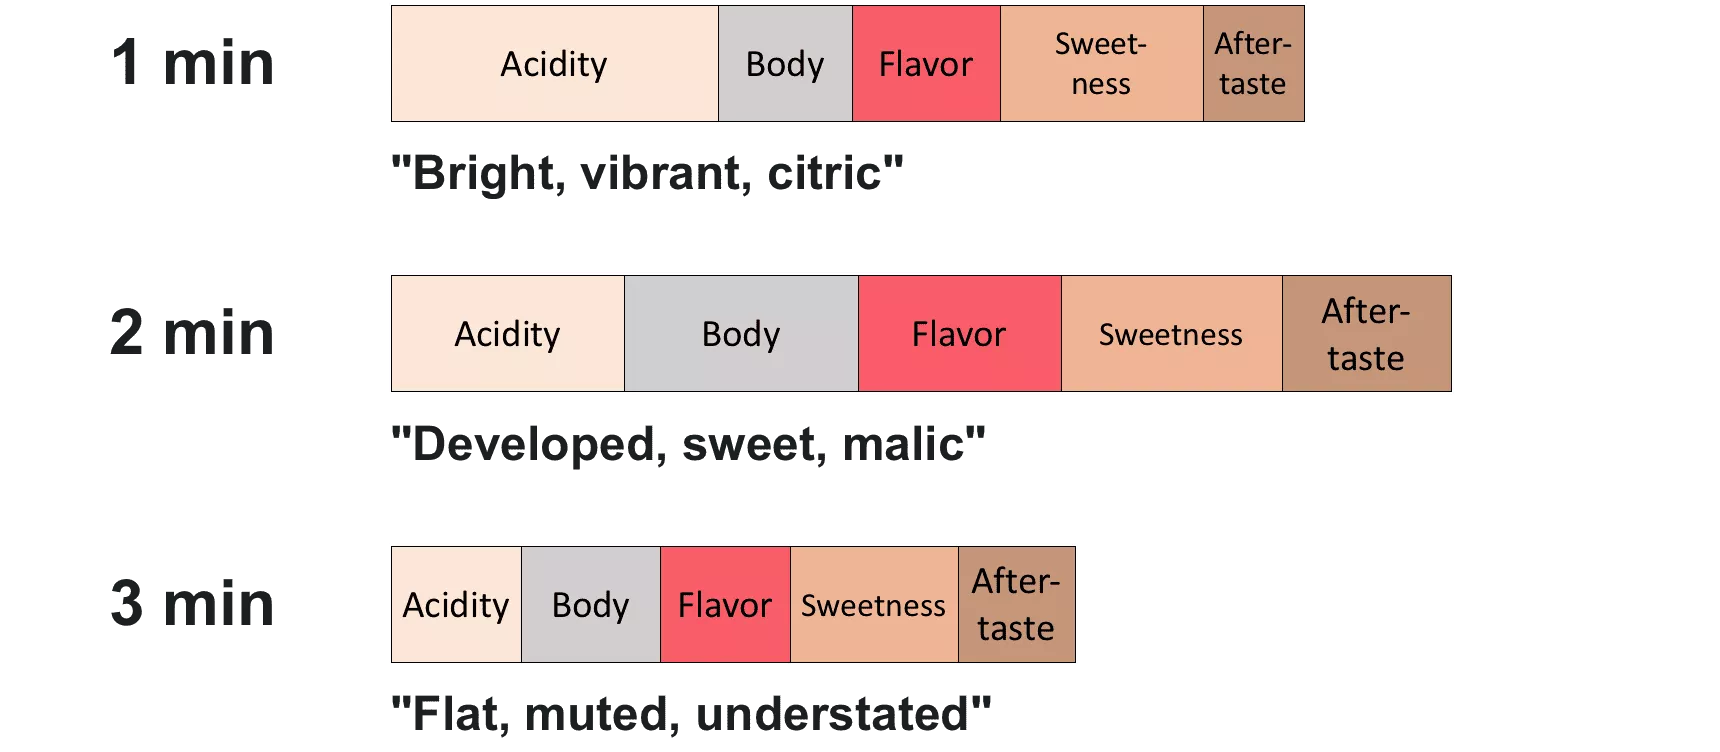
As shown, by varying the length of the development phase, we could determine the amount and type of acidity. These findings fit with the conventional wisdom which states that the longer the development phase, the less acidity in the final cup. Also, the acidity might became milder and more malic like when we stretch out the development phase more, giving the final cup a more "round" overall impression. However, beware not to stretch the time too much - otherwise you will eventually be baking the beans!
Turning point (TP) difference
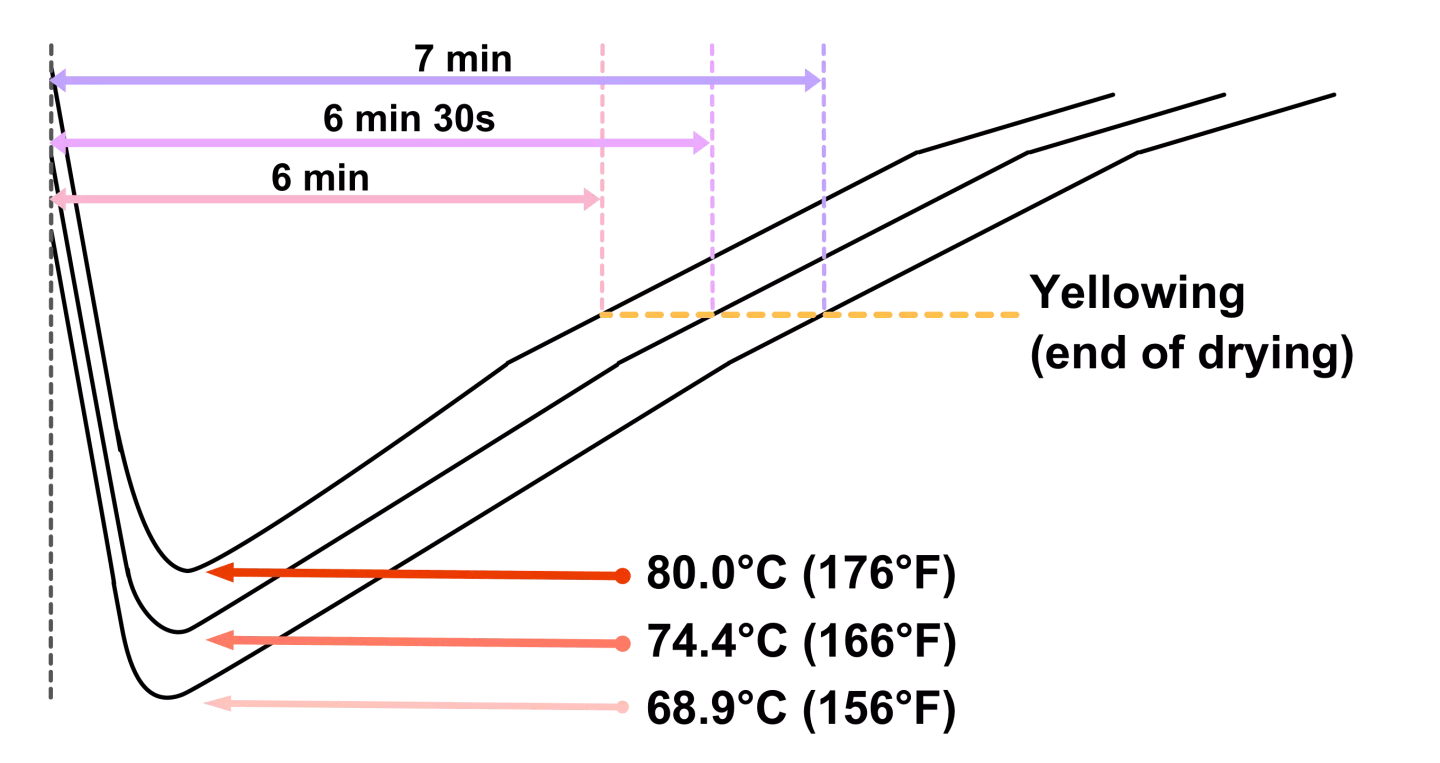
Turning point (TP) results
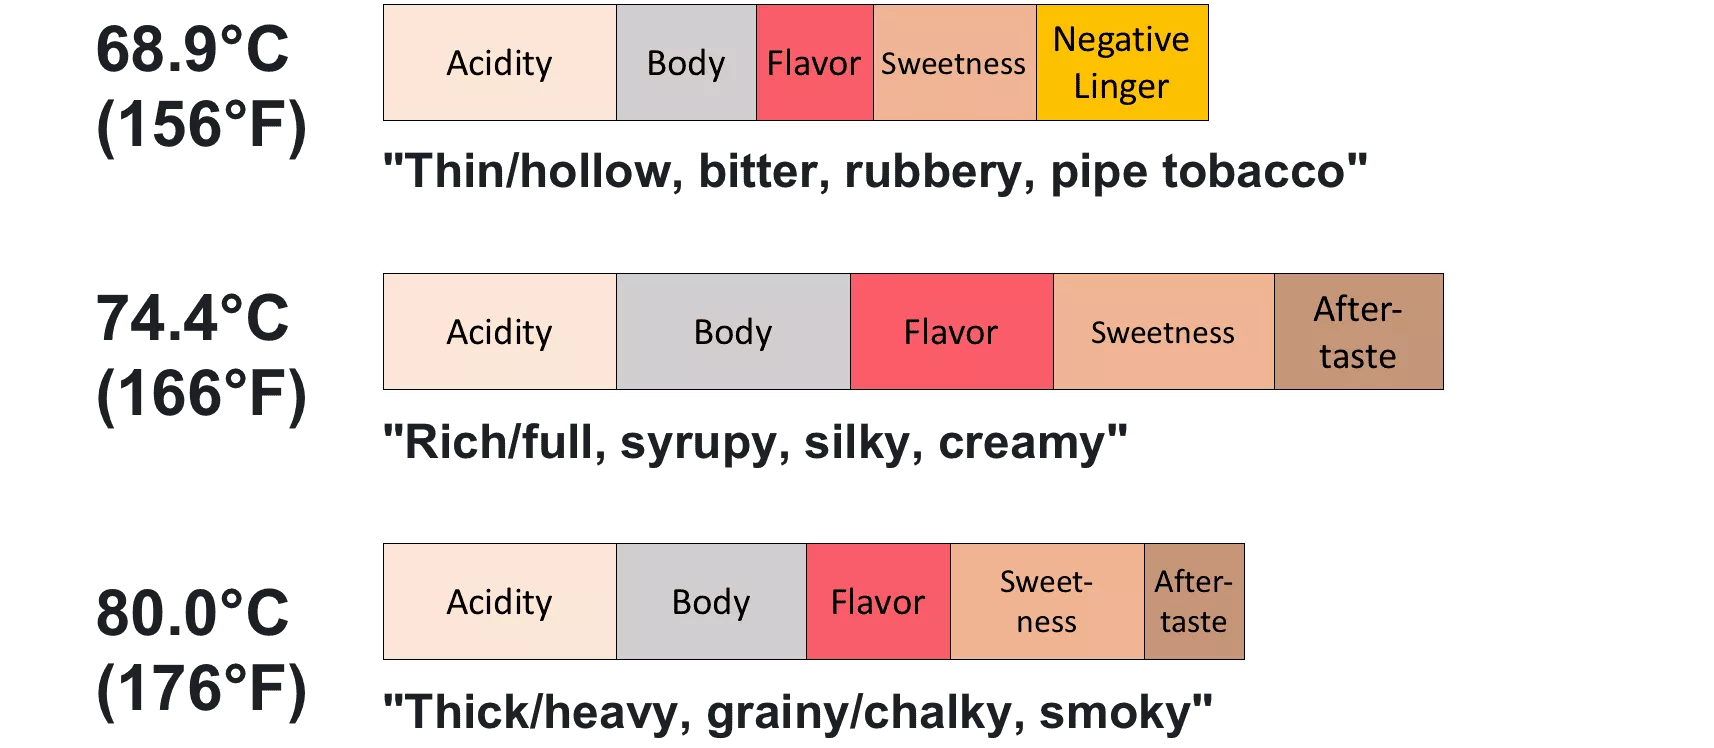
The result indicated that there might be an optimal window for turning point temperature. The turning point is one of the harder to interpretate numbers within a roast curve, and the widely accepted concept is that this temperature reading is where the beans, air within roasting chamber, and the bean temperature probe come to an equilibrium. However, it is also likely that the turning point temperature is an indication of how fast energy is initially applied to the beans. Hence, for different green coffees which take on heat differently, different "optimal" turning point temperatures can be expected. Here, Nicki also shared that for her roasting processes, she would tend to have a slightly higher turning point temperature for washed coffees and slightly lower turning point temperature for naturals.
Peak ROR difference
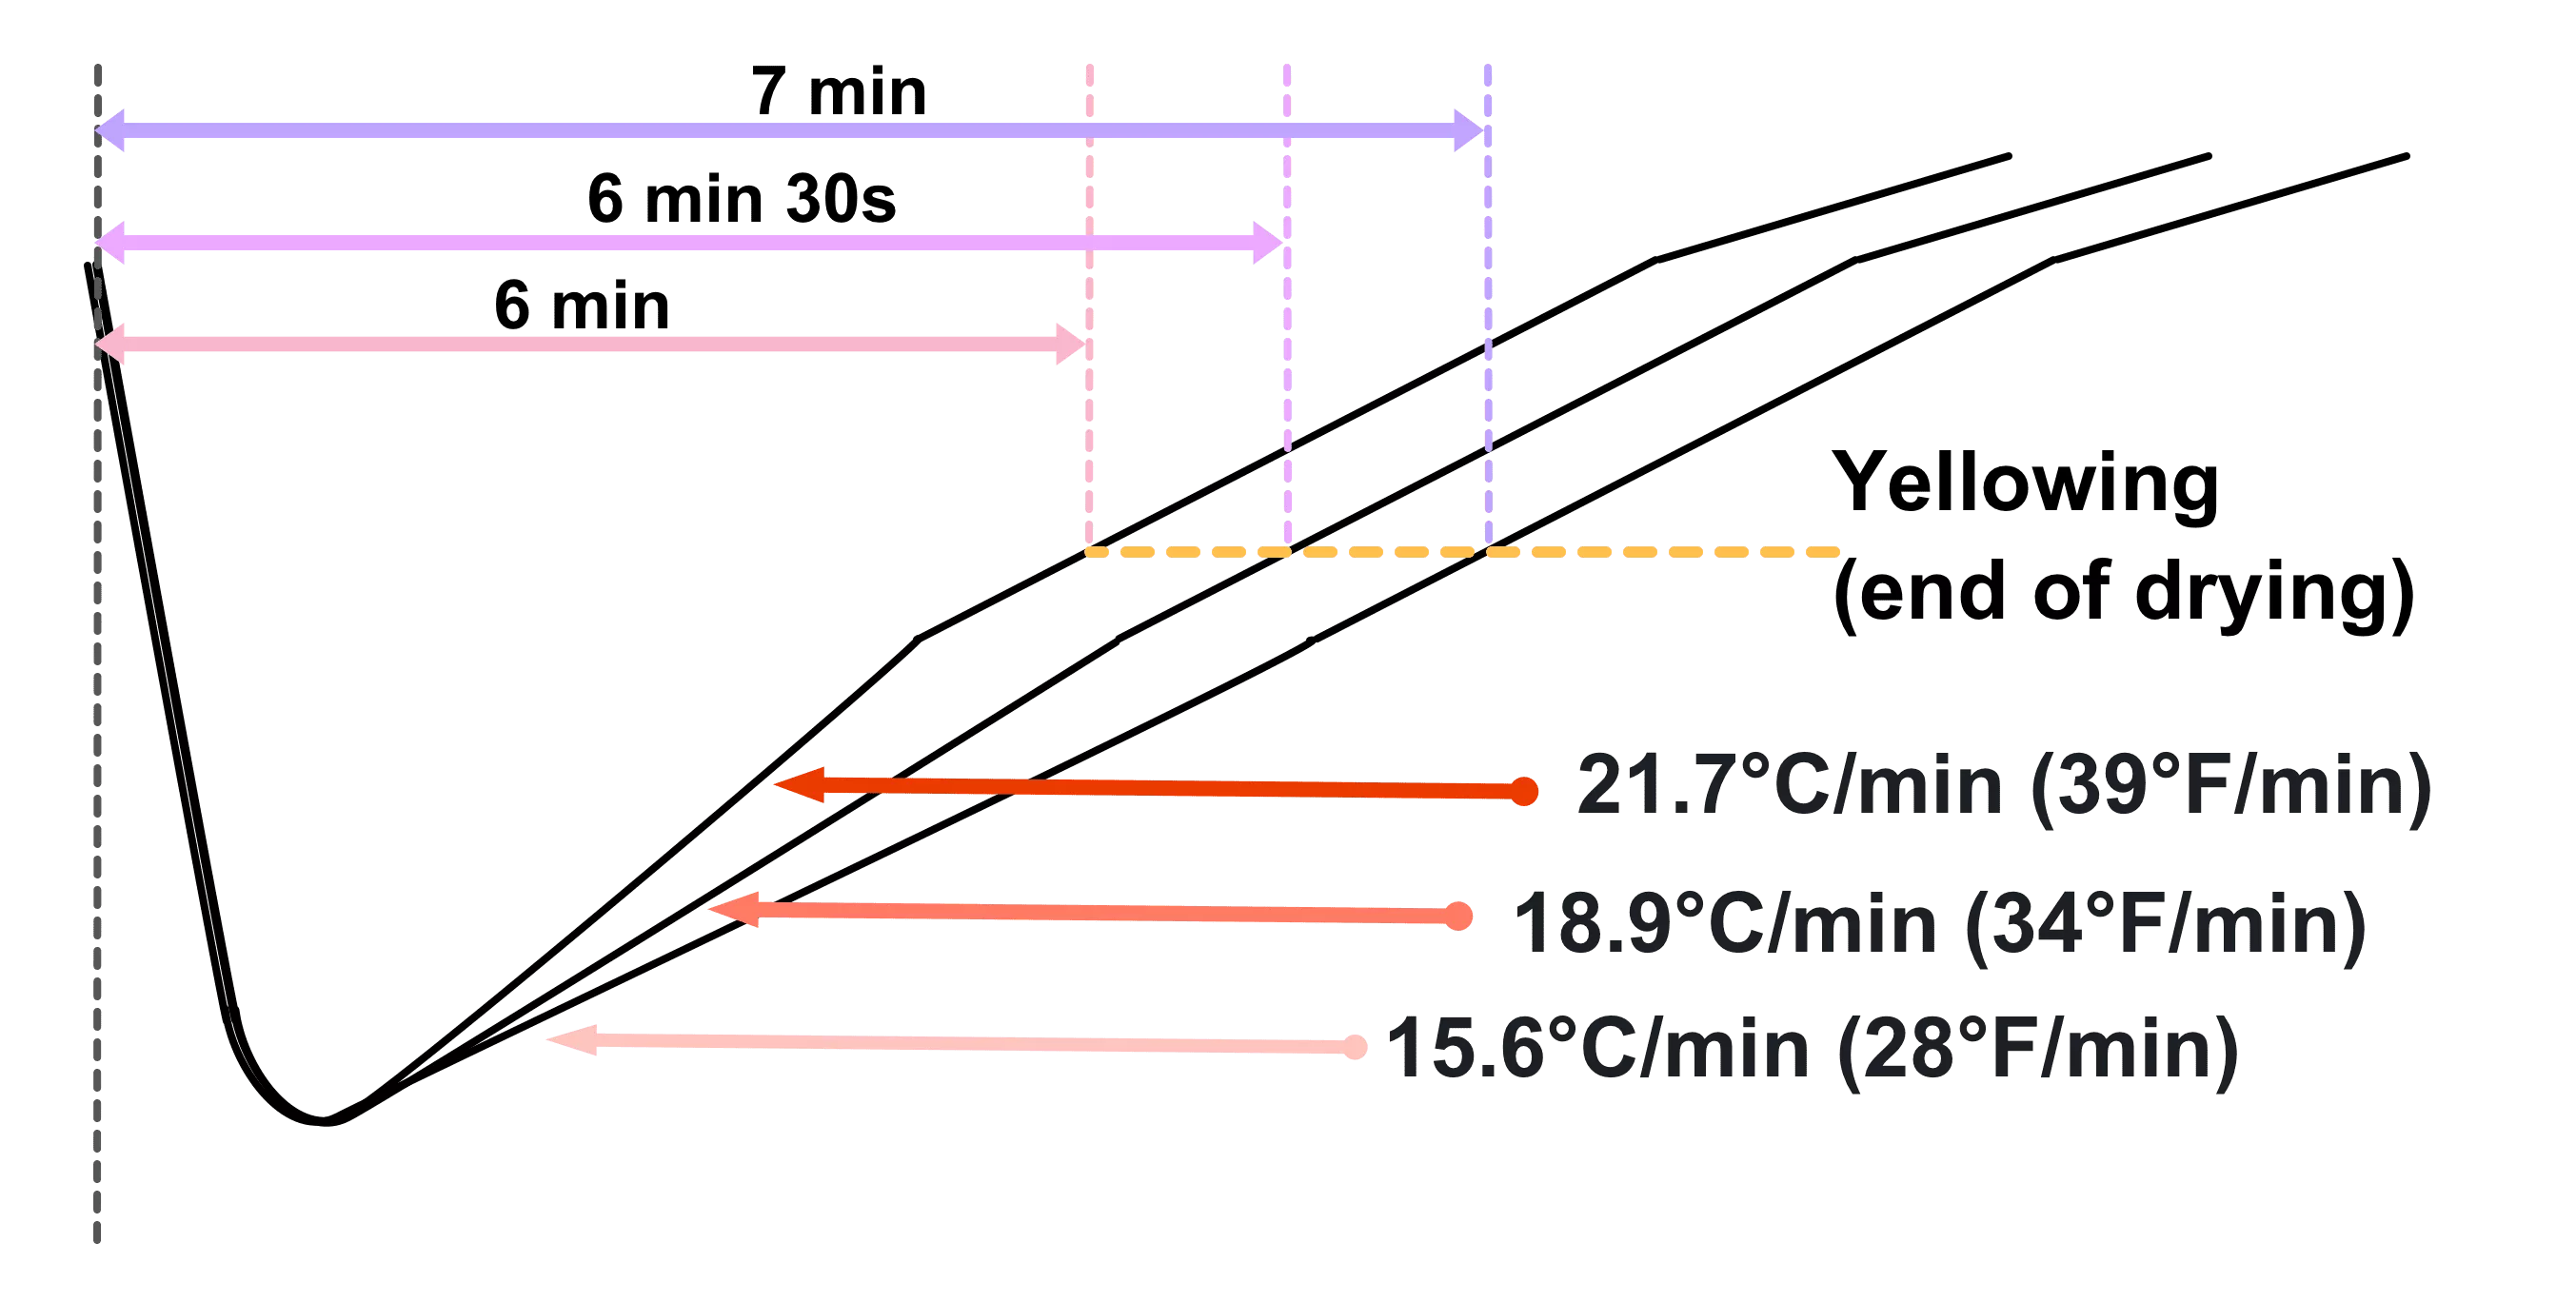
Peak ROR results
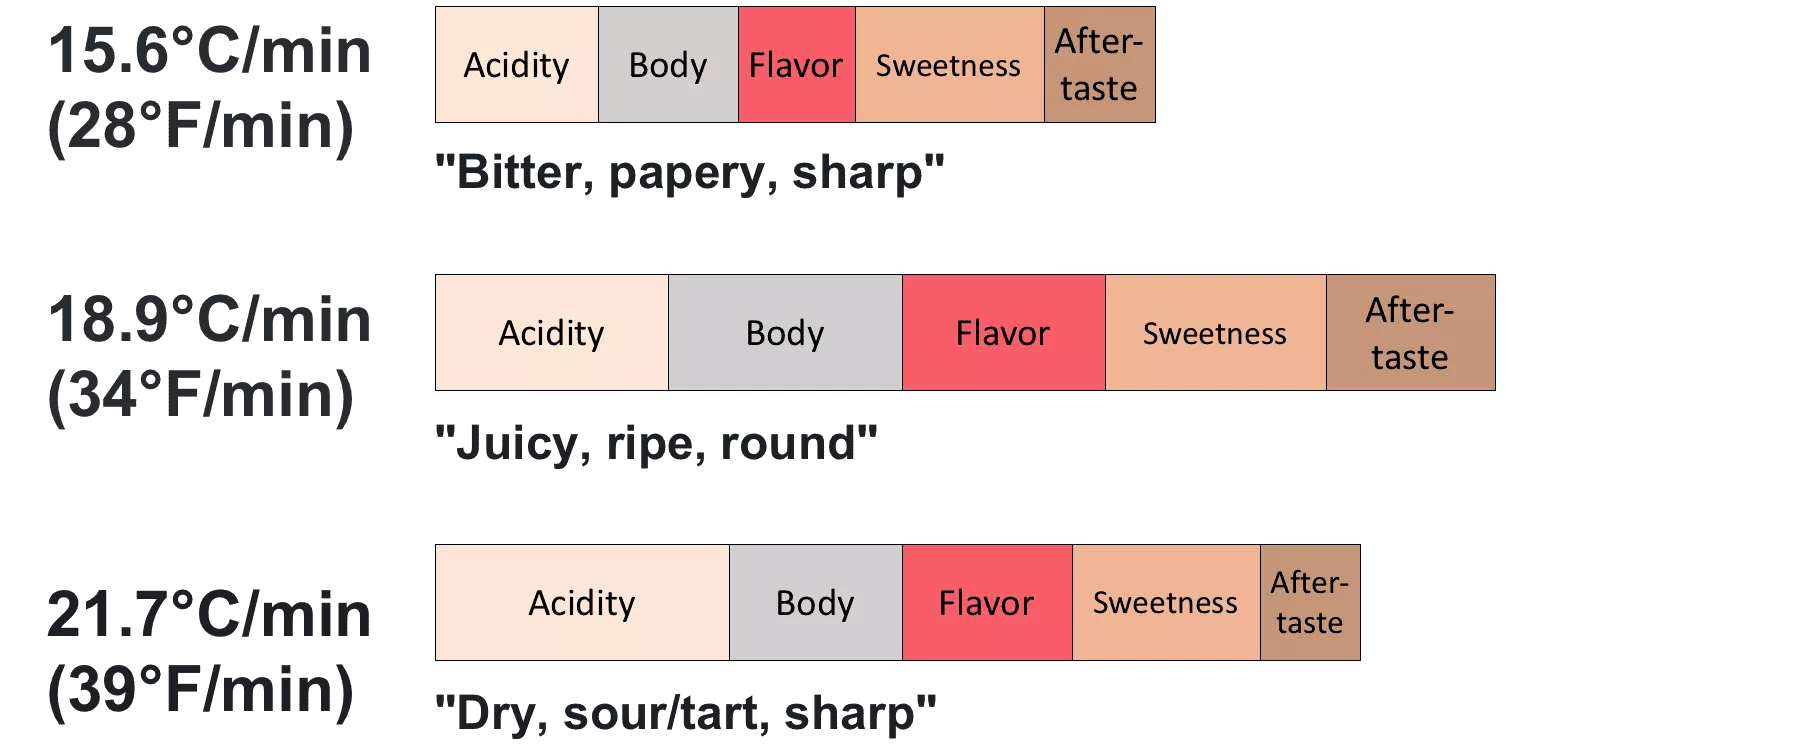
Energy application in the earlier stages of the roast can also be adjusted by having different peak rate-of-rise (ROR) values. Nicki shared one particular example regarding this topic, "(for a washed Guatemala coffee that have a peak ROR value lower than the usual target) Tasting the 39°F/min peak ROR roast next to the 34°F/min peak ROR roast, the dryness (of the 39°F/min one) does become apparent. The 39 degree ROR one is distinctively sweet, but it's a dry and sharp sweetness". Nicki recommended to use this number as a way to fine tune your roasts, and she also advocated that instead of keeping a fixed yellowing (end of drying) time target, one can also try roasting by aiming for a target peak ROR value and allowing the yellowing time to vary.
Roasting Dynamics and final Flavors in Cup
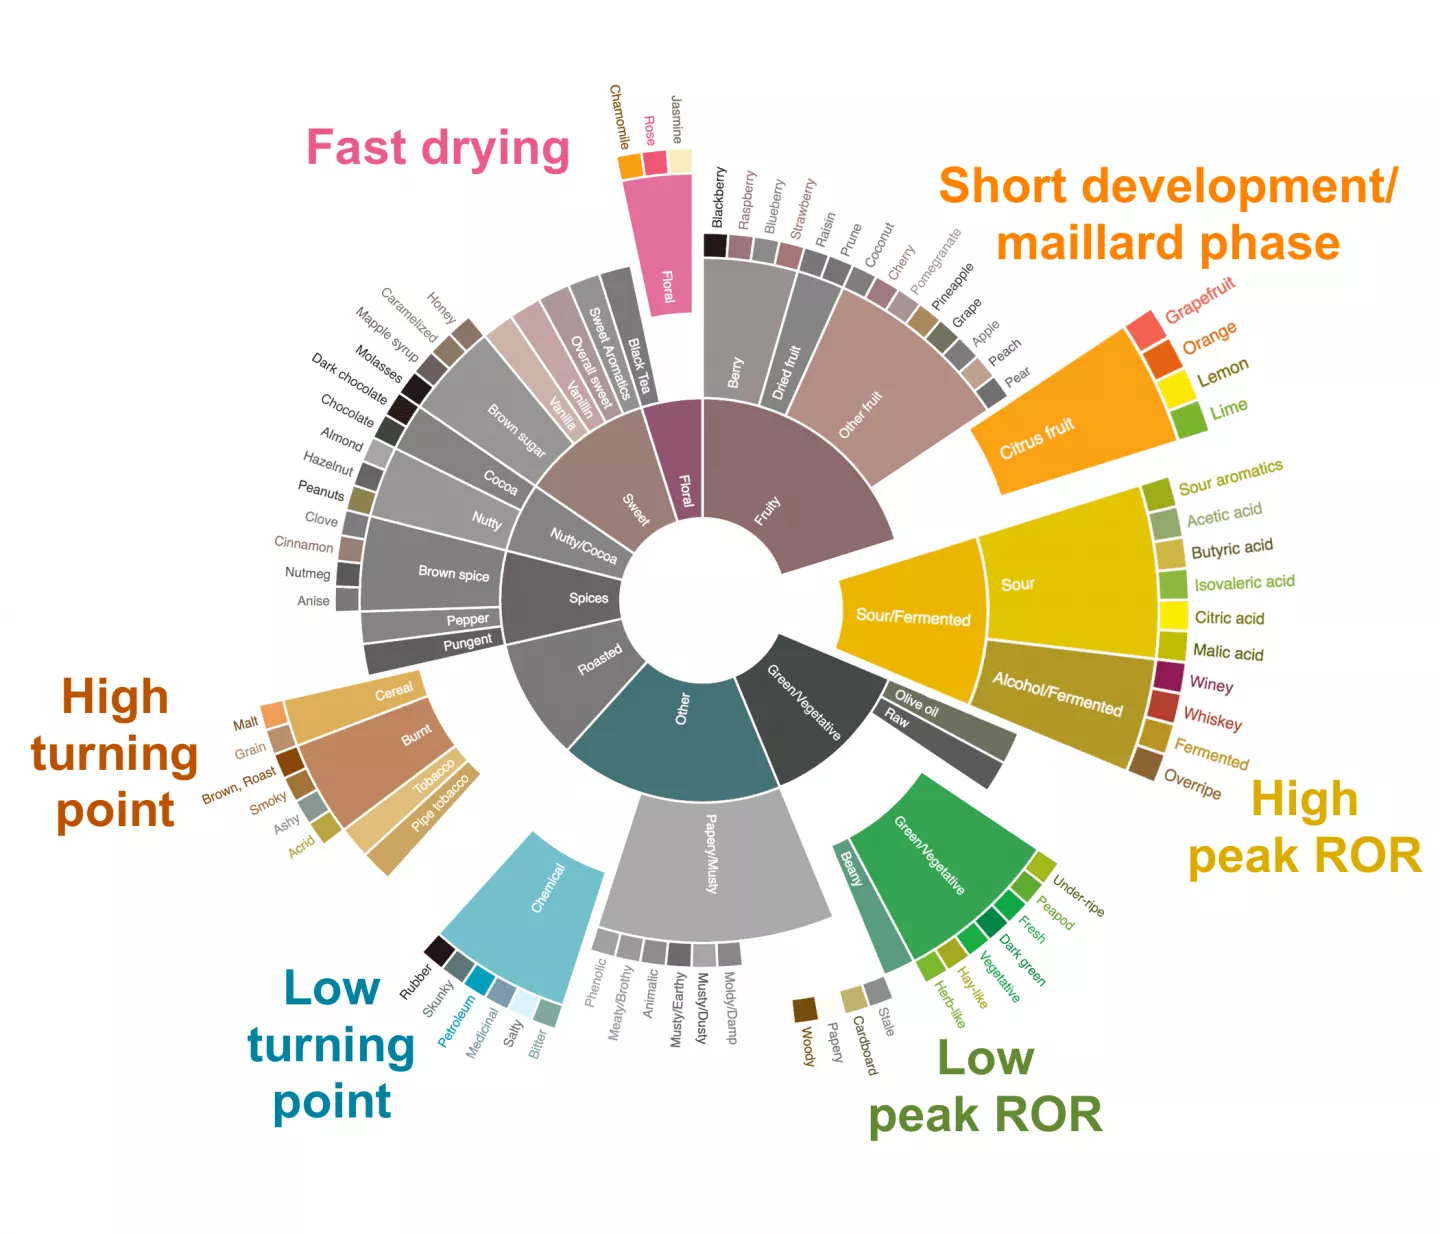
At the end of this roast summit session, Nicki gave an excellent visualization about how different roasting dynamics (how fast you go through each segments of the roast) might contribute to the different flavors on the coffee flavor wheel.
This annotated flavor wheel can be used as a guide to troubleshoot your own roasts. If you identify certain flavor attributes in your roast that you don't appreciate, by checking this figure, you might gain a rough idea about what might be the reason behind it. Before closing up this blog, we would also like to include some tips and roasting mentality shared by Nicki herself. These include:
Roasting is all about momentum (and controlling it)
The word momentum has been used alot in discussions surrounding coffee roasting. Essentially, whenever this term is mentioned, its describing how a certain machine along with the green beans loaded inside react to the heat added. The absolute timimg of each of the roasting curve segments are not set in stone and may vary depending on your equipment, but how the flavors are modulated might be similar to what was shown in this blog. So the take away here is to try similar experiments with your own roaster, varying one variable at a time, then assess the outcomes based on taste. As Nicki puts it, "If you have control over momentum and the rate of rise, you don't need time goals. They don't translate well machine to machine, and it makes you not look at what you should be looking at - which is momentum."
Taste everything, even mistakes
Don't look too much into the curves before tasting them first. If you decided that one coffee is tasting phenomenal, there is absolutely no reason to frown upon it just because the roast curve didn't abide to some kind of rule or widely accepted dogma. Also, one of the main ways for us to experiment with new flavors and balances of coffee is to actually taste something new, so don't be too frustrated at first when a roast didn't go as planned, taste it, and you might have just discovered some really important lessons or gone through a whole new kind of drinking experience! Even if the outcome really is tasting faulty and awful, please realize that the process of tasting your failures is also a very important aspect of learning to roast coffee. You have to know that how a potentially less than ideal operation (too much/less heat, too fast/slow etc.) might influence the final cup, and based on this judgement you can then try to improve your future roasts (maybe with the help of some of the information above, hopefully).
Closing marks
Congratulations! You have reached the end of this blog post. Now, just as some of you might be, we are excited to try out some of the ideas and concepts mentioned above. But as many of you might have experienced, altering one and only one segment of the roast curve is easier said than done. Prior planning based on sufficient experience with your machine is required, and the responsiveness of the roaster is also a big part in play. Luckily, with the near-infrared heating technology on Rubasse roasters, large changes in rate-of-rise can easily be achieved in a short period of time, making the roast curve experiments much easier to be carried out. Whats more, after playing around and finding a nice, expressive, balanced and sweet roast, you don't need to worry that you might never recreate it again - we have you covered! With our Autopilot Profile Replication system, replicating a roast curve is as simple as selecting the file and pressing the "Auto" button. Our integrated smart roaster handles the process from charge to drop, so you might as well go make yourself a cup of coffee while the machine roasts some more for you!